
Prism Map Studio · a Prism Labs product
A map workspace in your browser.
Add your own data, run more than a thousand analysis tools, ask your layers with SQL and make finished maps. Nothing to install, and files you add open in your browser, without an upload.
Free for anyone, with no account, and it works on a phone too.

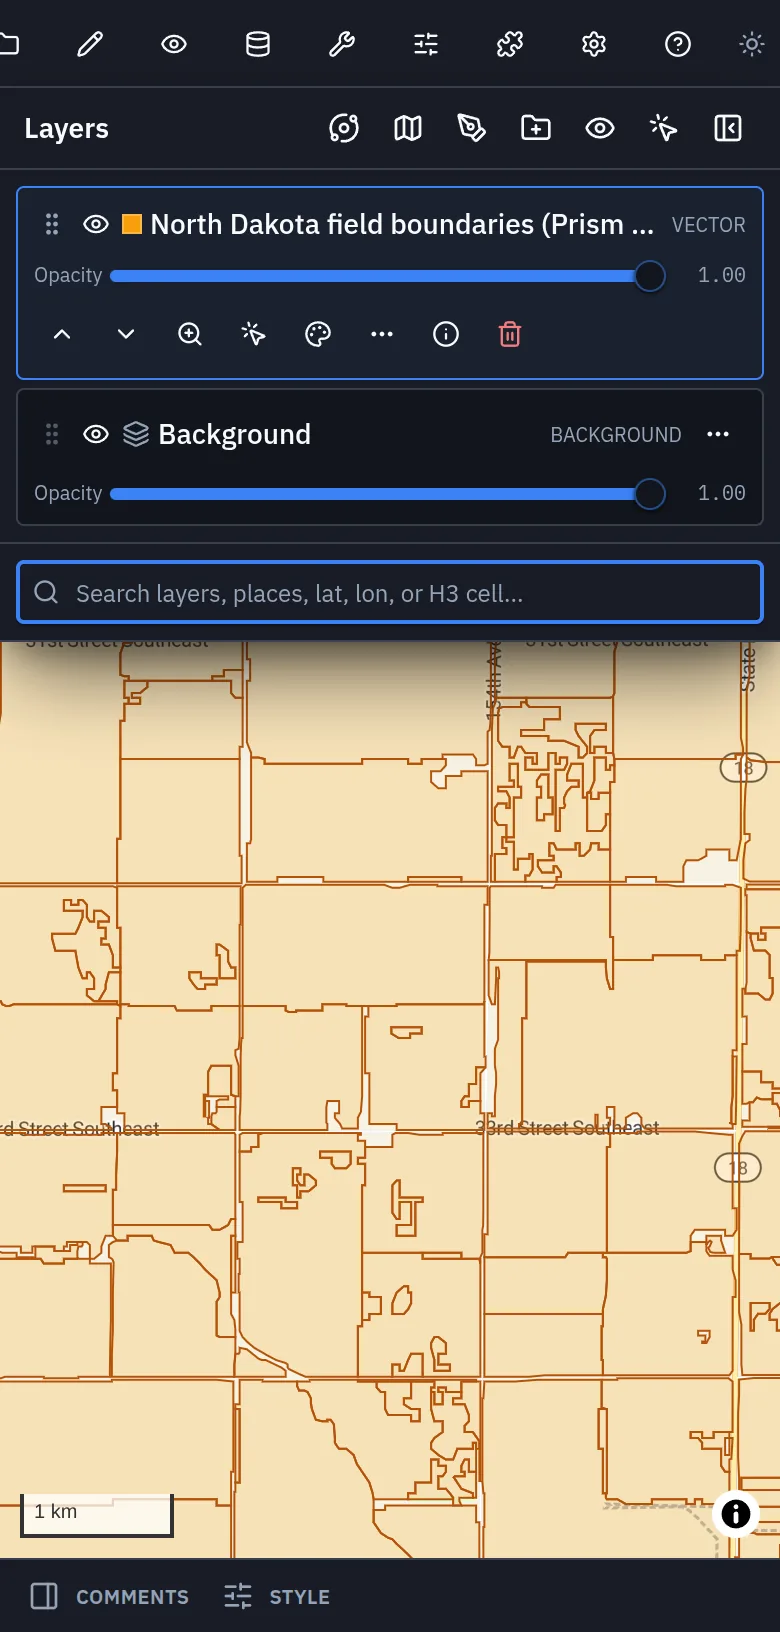
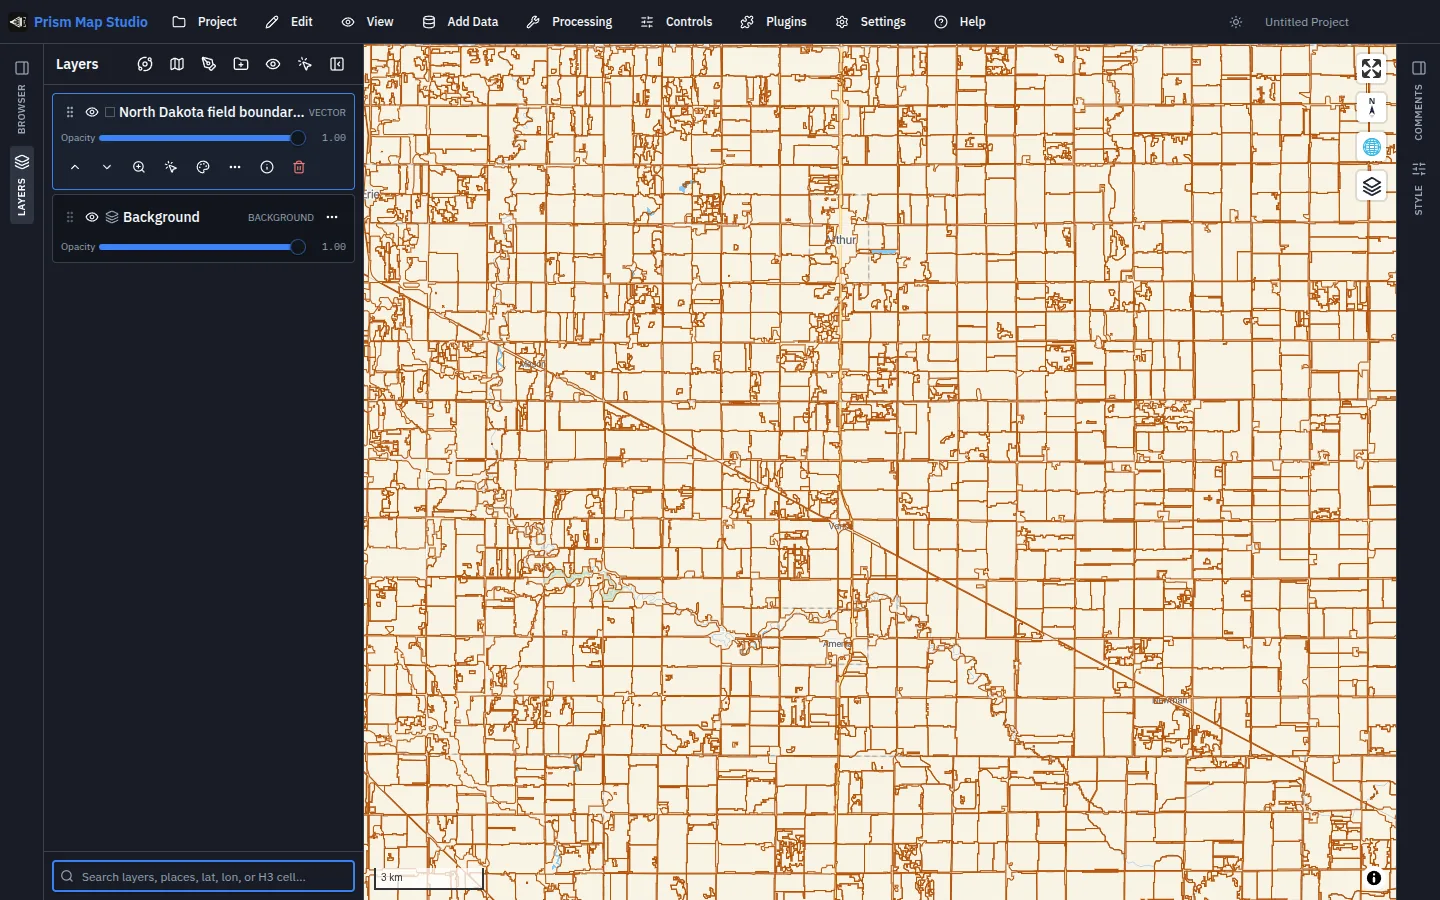
The live product, with North Dakota field boundaries from Prism Microclimate
Your data
Drop a file on the map. It opens right there.
- The formats you already have.Drag and drop GeoJSON, KML, shapefiles, CSV, GeoParquet and rasters straight onto the map, or add a map service or a cloud file by its address.
- Opened, not uploaded.Files you add are read inside the page, not uploaded, until you share a map by link: that map is then kept on Prism Map Studio's server so others can open it. Tools that need an outside service (routes and travel times, US Census data outside North Dakota, Minnesota, South Dakota and Montana, satellite imagery, and the AI assistant with your own key) send it the places or questions they ask about, and a live session shares your map with the people in it.
- The work runs on your computer.Analysis, queries and styling happen in your browser tab, on your own machine. Route and travel-time calculations are the exception: they run on a routing service.
- Nothing to install, no account to start.Open the page and start. Sharing a map by link needs a Prism account, by invitation. The same workspace works on a laptop, a tablet or a phone.
Analyse
More than a thousand tools, in the browser.
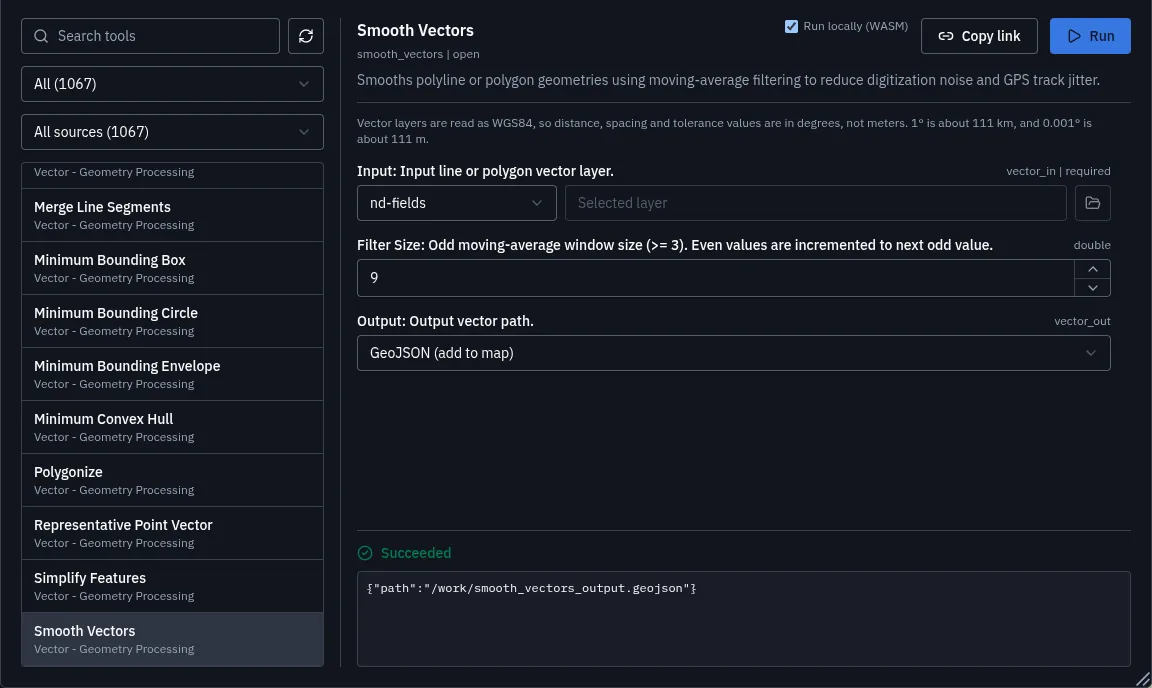
- Terrain and water.Slope, hillshade, watersheds, flow paths and wetness from an elevation model.
- Vector and raster.Buffer, clip, merge, smooth, simplify, reclassify and combine layers.
- Imagery and lidar.Remote sensing indices and point cloud tools for survey and drone data.
- Cloud formats.Convert your files to formats that stream quickly over the web.
On the farm
Agronomy tools, built in.
- Clean yield data.Remove the points a yield monitor gets wrong: speed and swath errors, the ends of passes, overlaps and outliers, with the reason for every point removed.
- Management zones.Build zones from yield or from several dates of a crop index, with each zone's area and averages.
- Variable-rate prescriptions.Set a rate for each zone and export it for the tractor as a shapefile or an ISO 11783 task file.
- Scouting priorities.Flag the parts of a field where a crop index dropped or lags its zone, ranked by size and severity.
From space
Satellite imagery for your fields.
- A season in one chart.Pick a field and the dates, and see a crop index for every satellite pass, with cloudy pixels masked and every left-out pass explained.
- Cloud-free pictures.Combine a season's passes into one cloud-free image of a field or of the map.
- What changed.Compare two dates, see where the index rose or fell, and how many acres changed.
- Classify and compare.Train a classification from a few labelled areas and get its accuracy report, or click a spot in a satellite embedding layer to find places like it.
- Time-lapse.Turn a season of passes into a video with the date on every frame.
Plan and model
Where it fits, and who it reaches.
- Suitability.Weigh slope, distance or any layer into one score, watch it change as you move the weights, then find the best areas of the size you need. Solar, wind, landslide and wildfire templates are a starting point you can edit.
- Surfaces you can check.Turn sample points into a surface by kriging, with the error at every place, and compare methods by cross-validation.
- US demographics.Census boundaries for any area, and population, income, housing and commuting with their margins of error: with no key in North Dakota, Minnesota, South Dakota and Montana, where Prism Map Studio serves the Census Bureau's files itself, and with your free Census Bureau key elsewhere.
- Markets and territories.Trade areas, store-choice models and balanced sales territories.
Ask
Ask your layers with SQL.
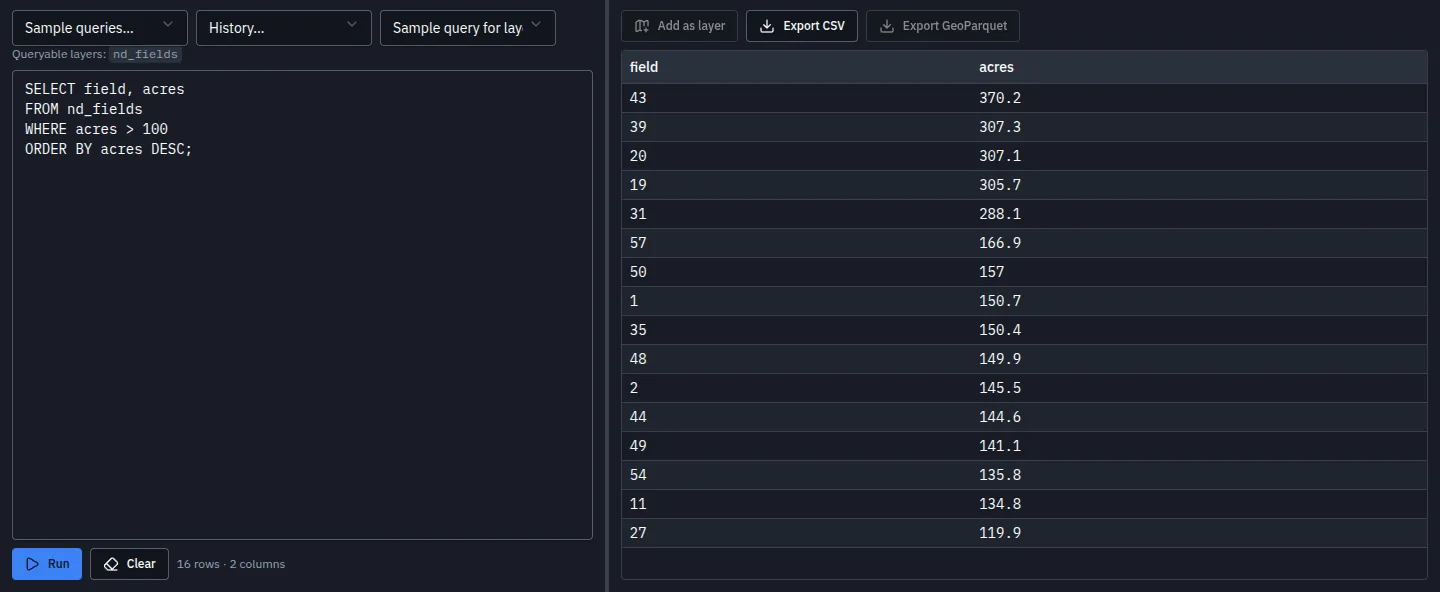
- Every layer is a table.Write a query over the layers on your map and see the rows at once.
- Results back on the map.Add the answer as a new layer, or export it as CSV or GeoParquet.
- Filters without code.Quick filters, joins and calculated fields for the questions that do not need a query.
Make the map
Style it, label it, print it.
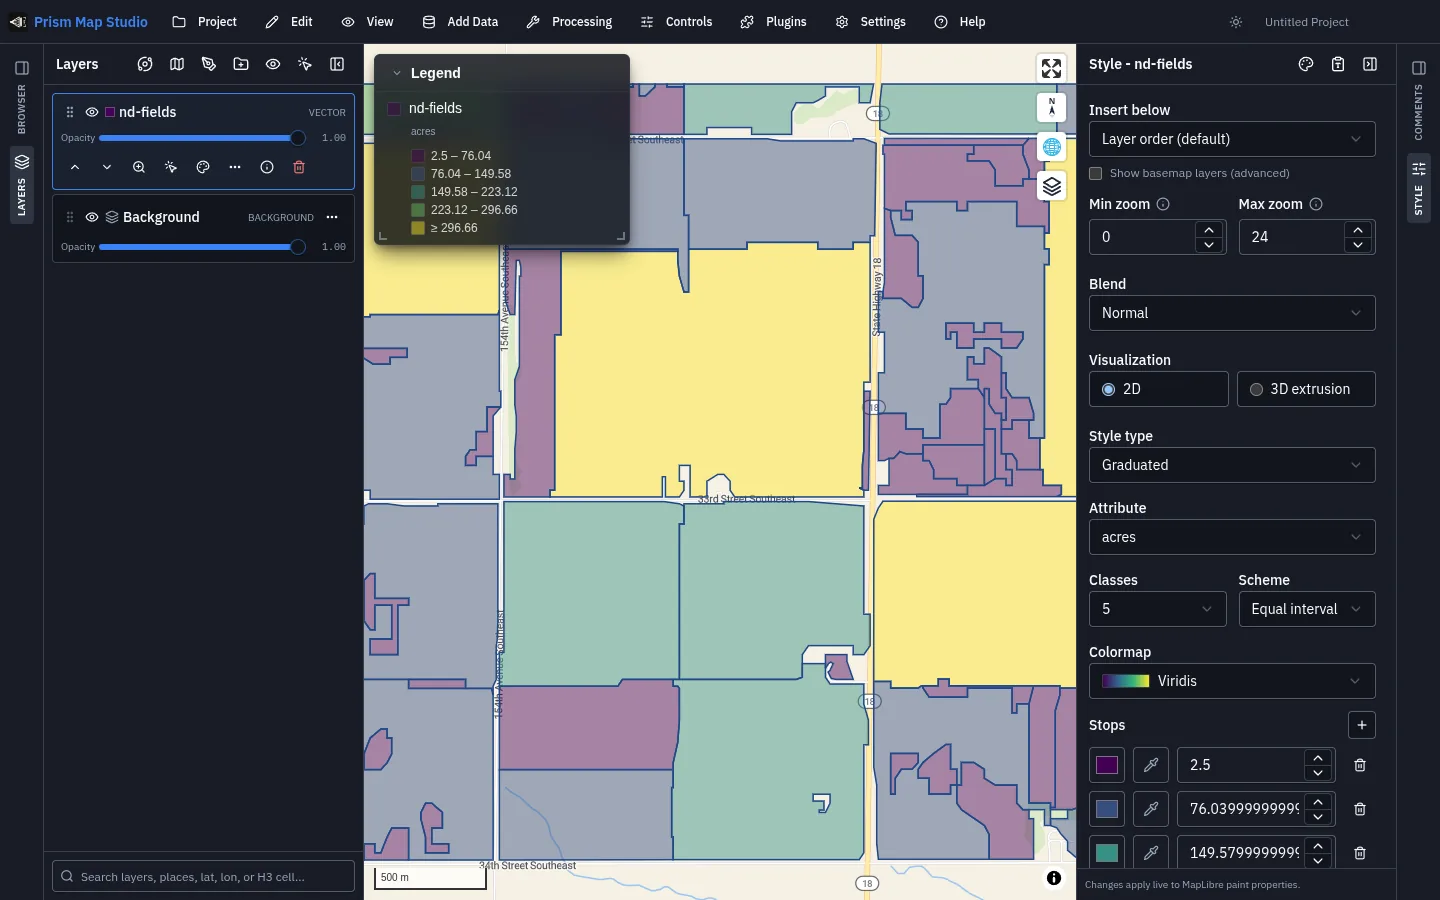
- Colour by what matters.Single colours, graduated and categorised styles, rules, patterns and 3D extrusion.
- Labels and legends.Label features from their own fields and add a legend that follows your styles.
- Print and export.Lay out a page for printing, or export the whole map as a web page.
- Story maps.Walk a reader through a place, one view and one paragraph at a time.
In the field
Collect data where it happens.
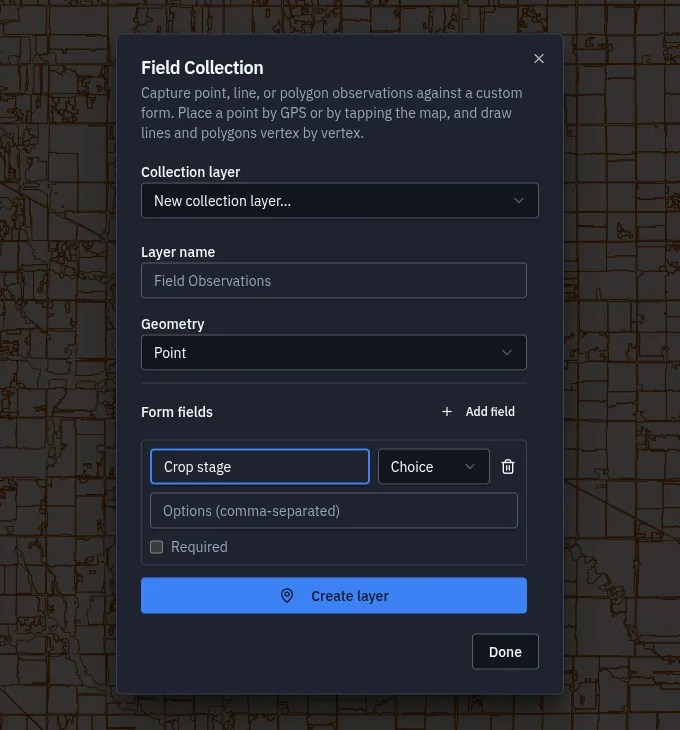
- Your own forms.Text, numbers, dates and choices, with calculated fields, defaults, repeating groups and choices that depend on other answers.
- Photos and GPS.Place a point from your phone's location or by tapping the map, and attach a photo.
- Points, lines and areas.Draw what you found vertex by vertex, or enter a survey traverse by bearings and distances, then analyse it back at the desk.
- Quality checks.Rules that flag missing values, overlaps, gaps and slivers, and keep track of each issue until it is fixed.
- Live feeds.Follow vehicles or sensors from a live feed and get an alert when one enters or leaves an area.
Together
Work on one map, live.
- Live sessions.Start a session and share its code: everyone in it sees and edits the same map as it changes.
- Who is where.In the field, each person can choose to share their position with the session, and stop at any time.
- A notebook beside the map.Write Python in a notebook next to the map, and move the map and add layers from it.
On a phone
The same workspace in your pocket.
Map Studio fits a phone screen. Open it at the edge of a field, check a layer, record what you see.
Works with Prism Microclimate
Every North Dakota field, ready as a layer.
Prism Microclimate's 961,439 field boundaries across North Dakota are a ready layer in Map Studio. Add them from My Data in the Browser panel, then measure, filter and style them next to your own data.
Part of one platform
One of the ways to work in Prism.
Every field in North Dakota, with its evidence.
Field-level weather, soil and risk for growers and the people who advise them.
See Prism Microclimate → Prism XHardware that joins the workspace.
Robots, sensors and edge computers that take a seat beside your people and your agents.
Meet Prism X → Prism DesktopOne workspace. Any AI. Your data.
Your team and your AI agents in the same channels, for chat, code, mail and meetings.
Explore the product →Where it stands
Where it stands, and what comes next.
Live and open to anyone since 27 September 2026, on a computer or a phone: more than a thousand analysis tools, SQL over your layers, finished maps, and every North Dakota field boundary as a ready layer. Since 9 October 2026 it adds agronomy tools, satellite imagery for your fields, suitability and interpolation models, US demographics, quality checks and live sessions with your team. Since 10 October 2026, people invited to a Prism account can share a map by link, and census data for North Dakota and its neighbours comes from our own copy of the Census Bureau's files.
- Pilots with analysts and agronomists working on their own layers.
- A prescription file loaded on a real tractor terminal.
- Map Studio beside the rest of Prism in the same workspace.
The tools added in October were checked against hand calculations or other software before they shipped, and the public site is walked in a real browser after each release. The rest of the validation is use: what pilot analysts map, and what they still take elsewhere.